User Guide
This document is intended to be a user guide to inform on how to use the Probator UI.
Dashboard
Below is a screenshot showing what the dashboard looks like (click image for full resolution):

Summary
The top section gives you a quick overview of the types of resources and issues the system is currently tracking.
The first graph shows a breakdown of the resource types and you can hover your mouse over the individual slices or their legend entry to see the number of resources for each type. If you click the legend entry you can toggle each resource type in the donut.
The second graph shows a breakdown of active issues created by the system. The graph works just like the Resource graph, allowing you to see more information and toggling types on and off.
Account Compliance
This section contains a breakdown of the auditor compliance of each account. These gauges will track the individual accounts issue count vs the number of resources in an account, with 100% (fully green) being entirely compliant.
Browse
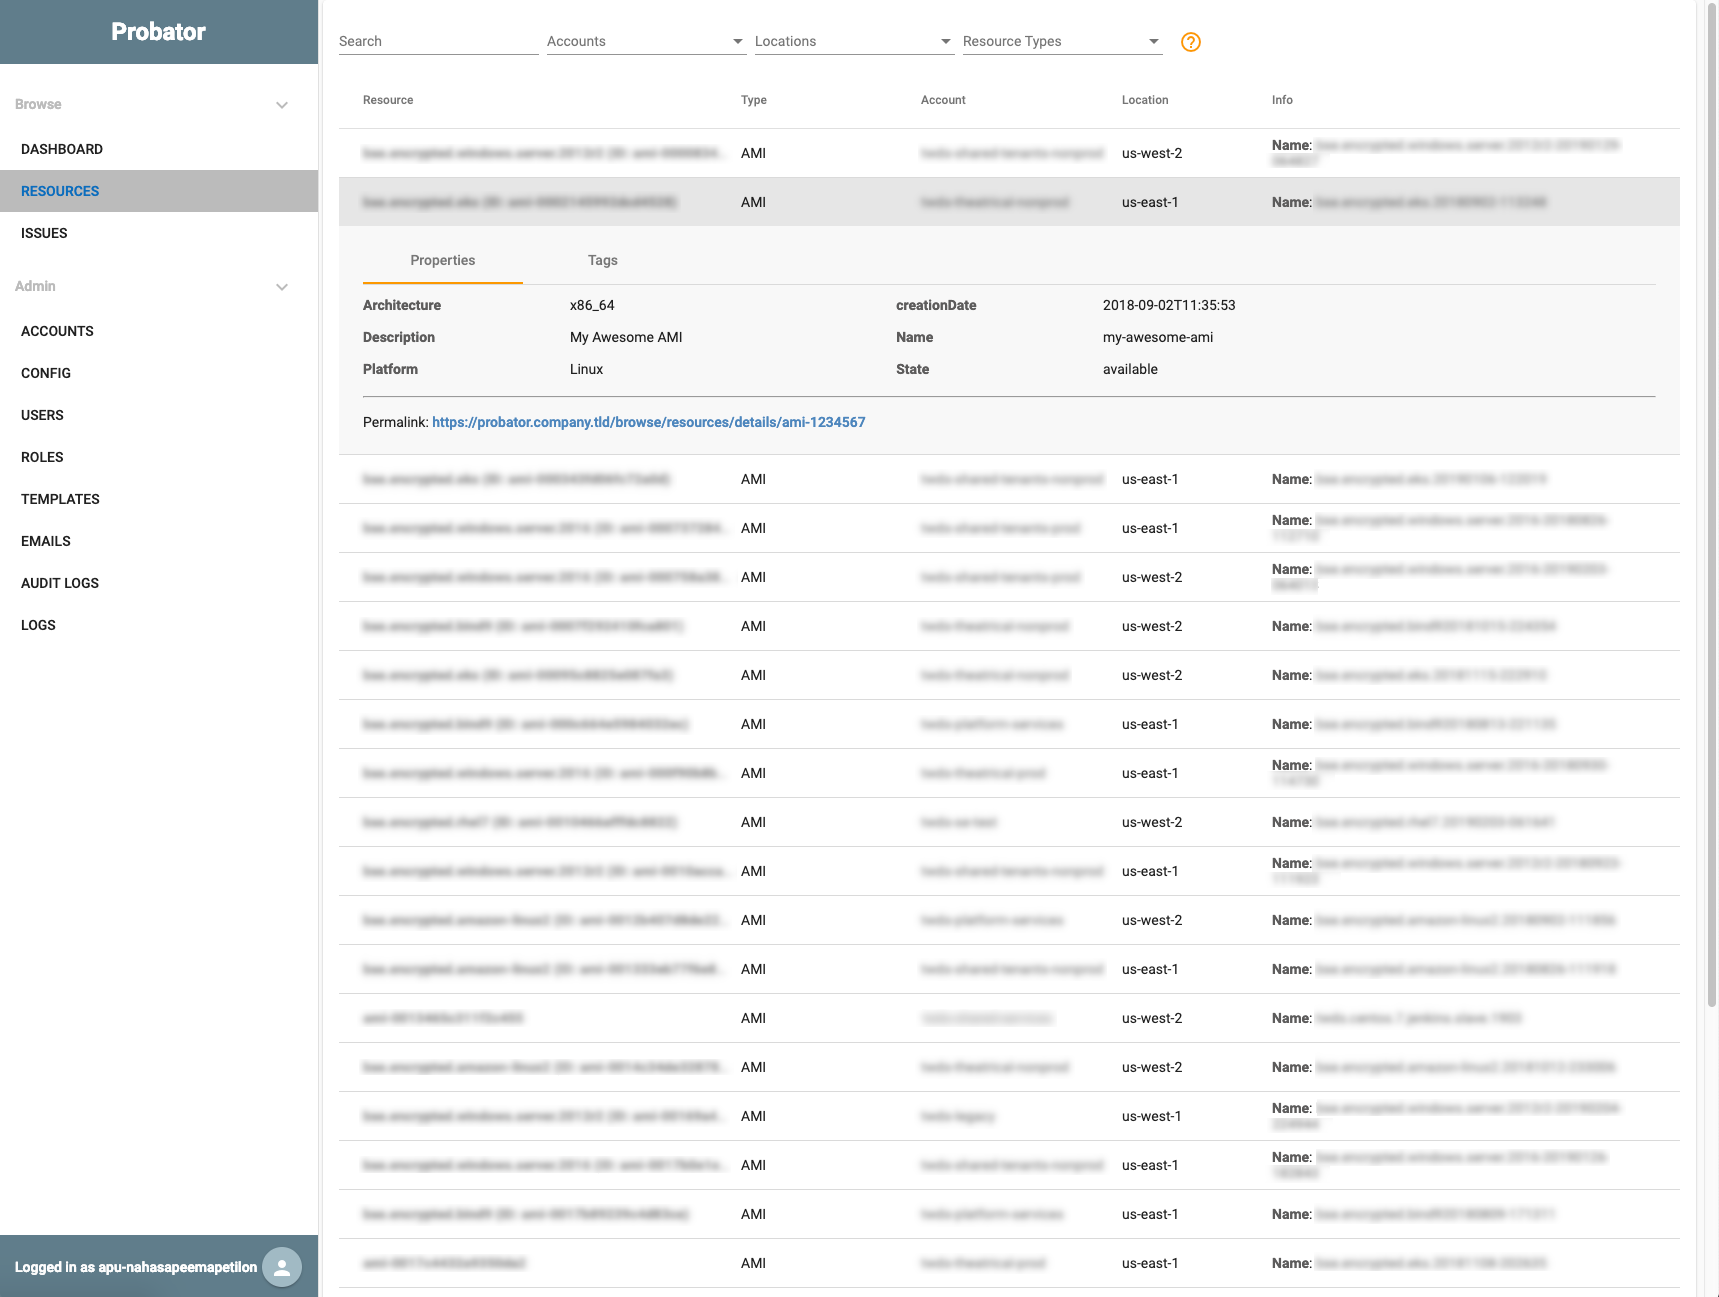
The browse section contains the pages that are available to all users, which lets you browse all resources and issues for which your user has access (Admin users have

Admin
When logged in as an user with Admin permissions, you will also see the admin menu with the following entries
Accounts
Allows adding, editing and removal of accounts from the system.
Note: If you remove an account, ALL related resources and issues will be permanently deleted from the database. If you want to leave an account in the system, but simply just disable the collection and auditing, you can disable the account through the Edit page
Config
All configuration settings for the core framework as well as all plugins. All configuration options are created within a namespace, to allow different plugins to have options with the same names.
The core framework will create three namespaces; default, logging and api. These settings control basic settings such as which authentication or scheduler plugins to use.
On top of the three core framework namespaces, each plugin also has it’s own namespace for any settings related to the plugin. Collector and Auditor plugins will all have an attribute, enabled, for turning the plugin on or off, as well as an interval setting, which controls the frequency of the plugin (in minutes). For other settings, you can hover your mouse over the name of the setting and a tooltip will display more information,
Users
Add, edit and remove users from the system. If you are using a third-party system for authentication (OIDC, SAML, etc), some functionality may be disabled, such as changing the password for the user, as it would have no effect on the third-party user database.
Roles
Manage system roles. Roles can be used to limit visibility of Accounts for non-admin users, but adding a Required Role on the Accounts create or edit pages.
Emails
History of all notification emails the system has sent. Also allows you to resend an email if necessary
Audit Log
Log of all administrative actions, as well as audit actions.
As an example audit actions can include an admin user modifying settings in the UI or an auditor terminating an EC2 Instance.
Logs
This page contains the logs from all of the components. These logs can also be found on the disk of the instance(s) running Probator, by default in the /var/log/probator folder. Even if you run your worker processes on remote / multiple machines, they will all send their logs to the database so they are available in the UI.